
4th Grade Measures... Raisins?!
Source/Author: Christine Oman
September 17, 2014
If you are in fourth grade, how do you learn statistical terms?
With a box of raisins of course!
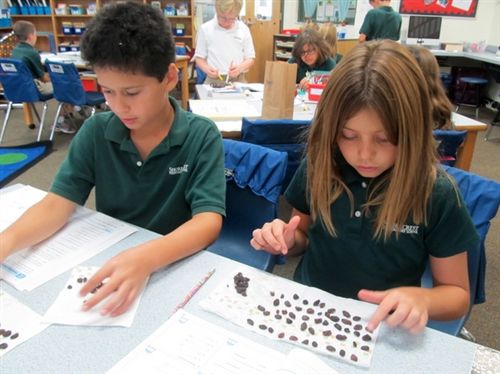
After “guessing” how many raisins were in a one ounce box, students were then asked to open the box and take a peek so their “estimate” could be more informed.
After actually counting the raisins, the class used a tally chart to record the data. Students then analyzed their findings to learn the maximum, minimum, range, mode, median, and mean for their set of data. The results? An average box of raisins has 68 delicious treats inside. Time for snack!


