


Ready… Aim… Fire! You sunk my battleship!
Source/Author: Curtis Cruise, Sixth Grade Science Teacher
September 18, 2020
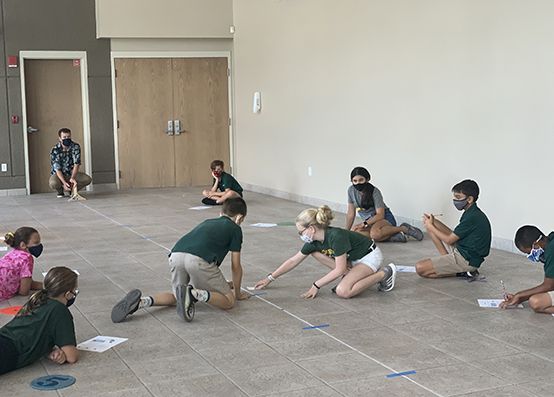
Sixth graders launched marbles and measured the distance the marbles traveled to practice the collection of reliable data. Next the students will calculate the data's central tendencies such as mean, median, mode, and range. Finally, they will use the data to create a graph. They will each have a choice to draw a graph by hand or use a spreadsheet.
Then the real fun begins! Using their graph(s), the students will predict the launch angle of the catapult to hit a target at a known distance.
This activity demonstrates the importance of collecting good data by performing multiple trials, and using graphs in order to make logical, scientific predictions.


 Certificate Program")


